Modern Dashboards with bslib
ShinyConf 2024
2024-04-18
shiny + bslib

library(shiny)
library(bslib)

ui <- fluidPage(
  theme = bs_theme(),
  # ...
)Is this a dashboard?
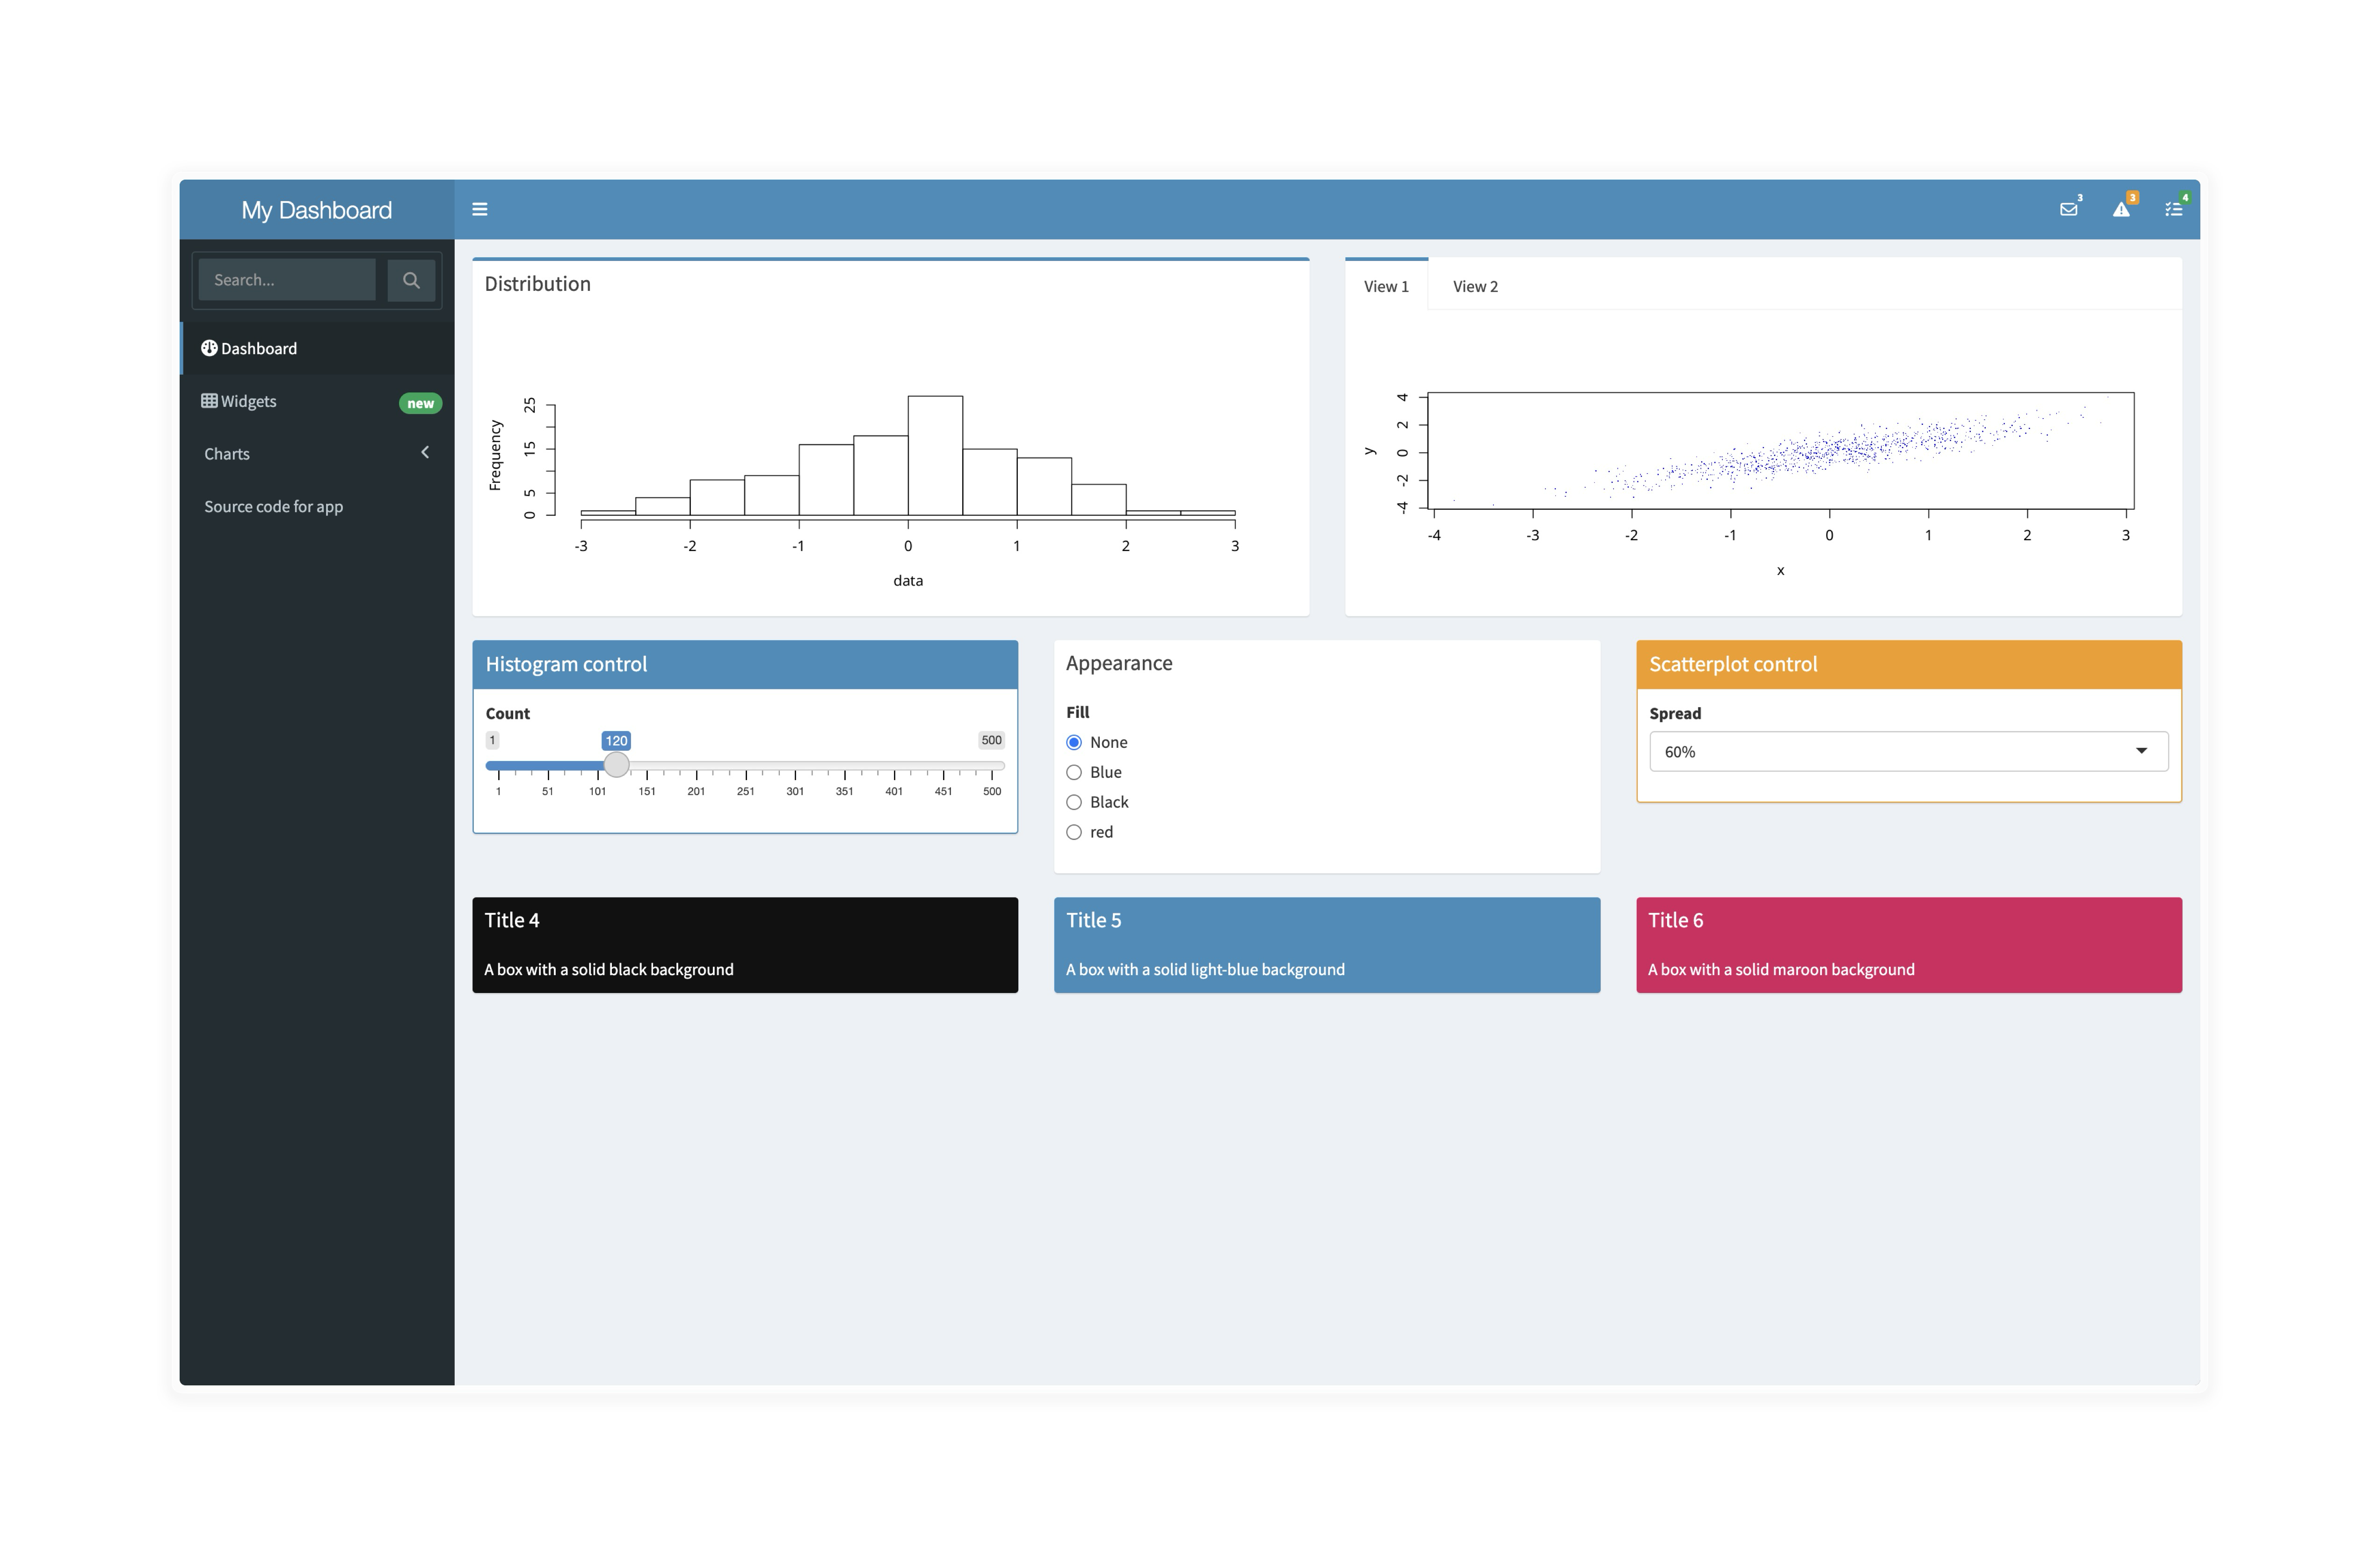
It’s only a dashboard if it’s from the shinydashboard package, otherwise it’s a ✨ sparkling dashboard ✨
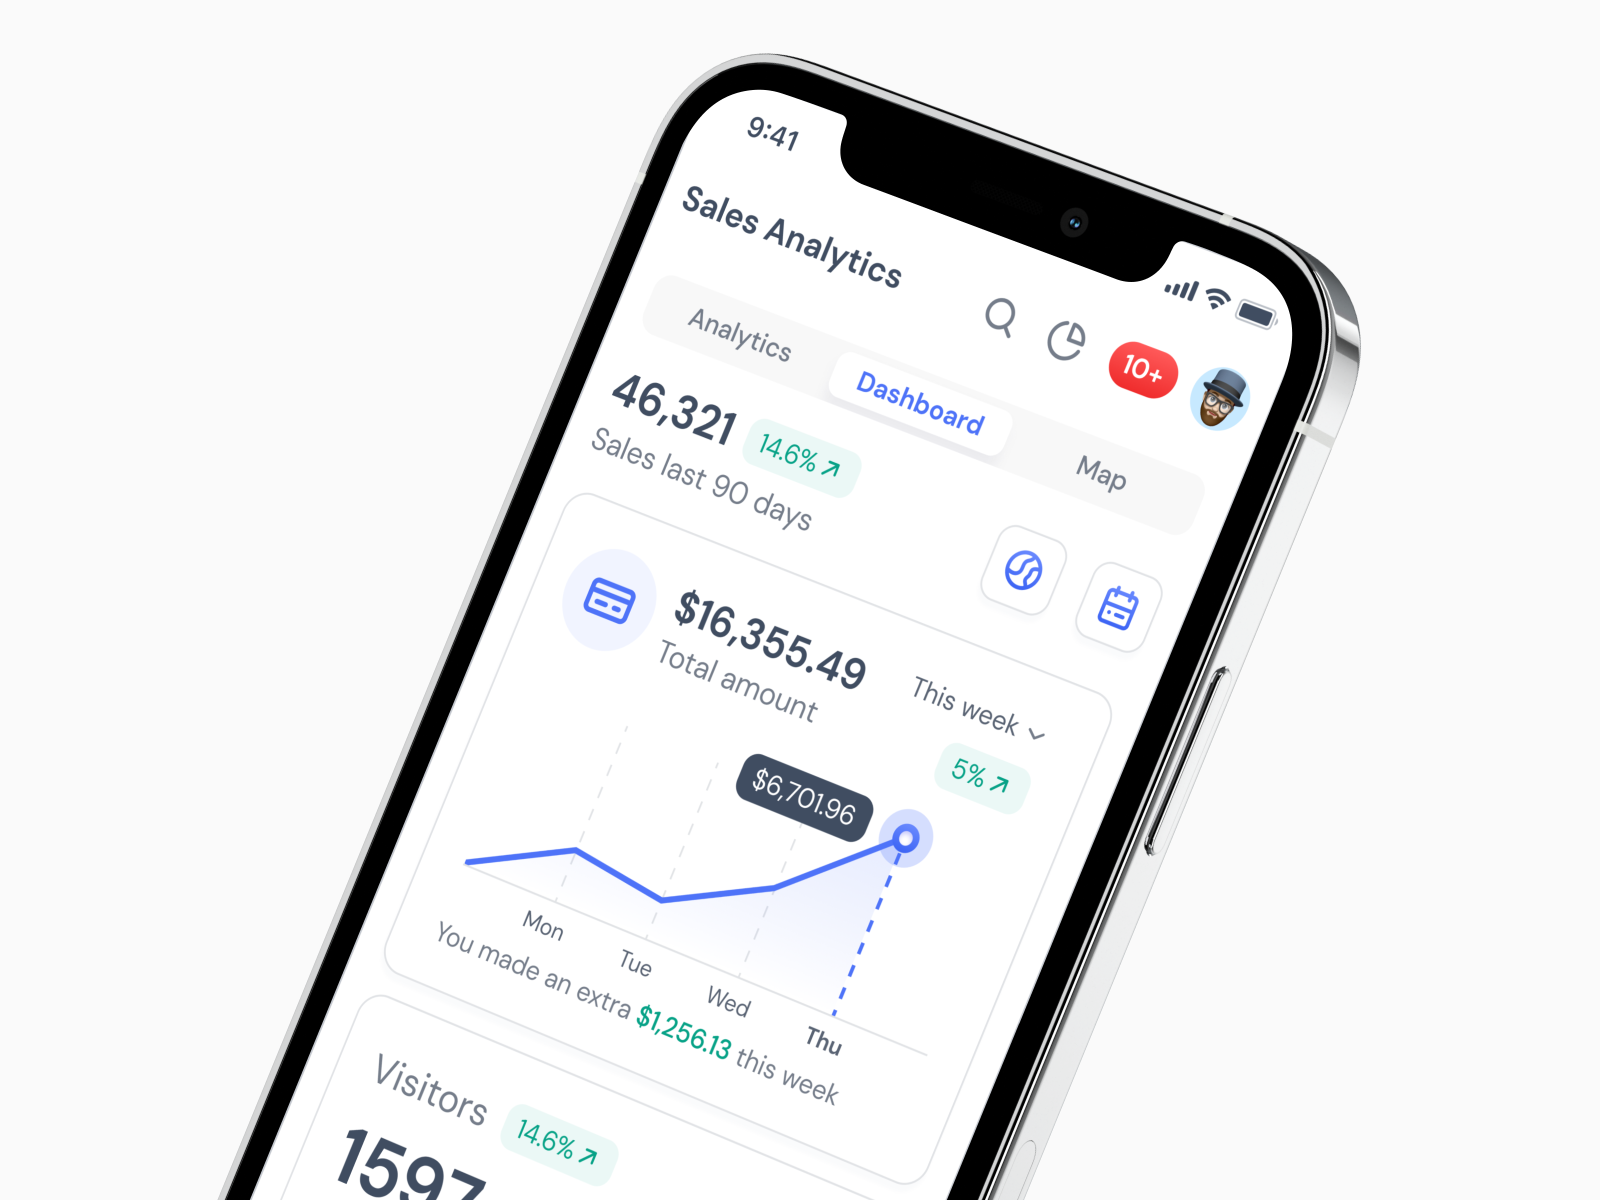
Is this a dashboard?
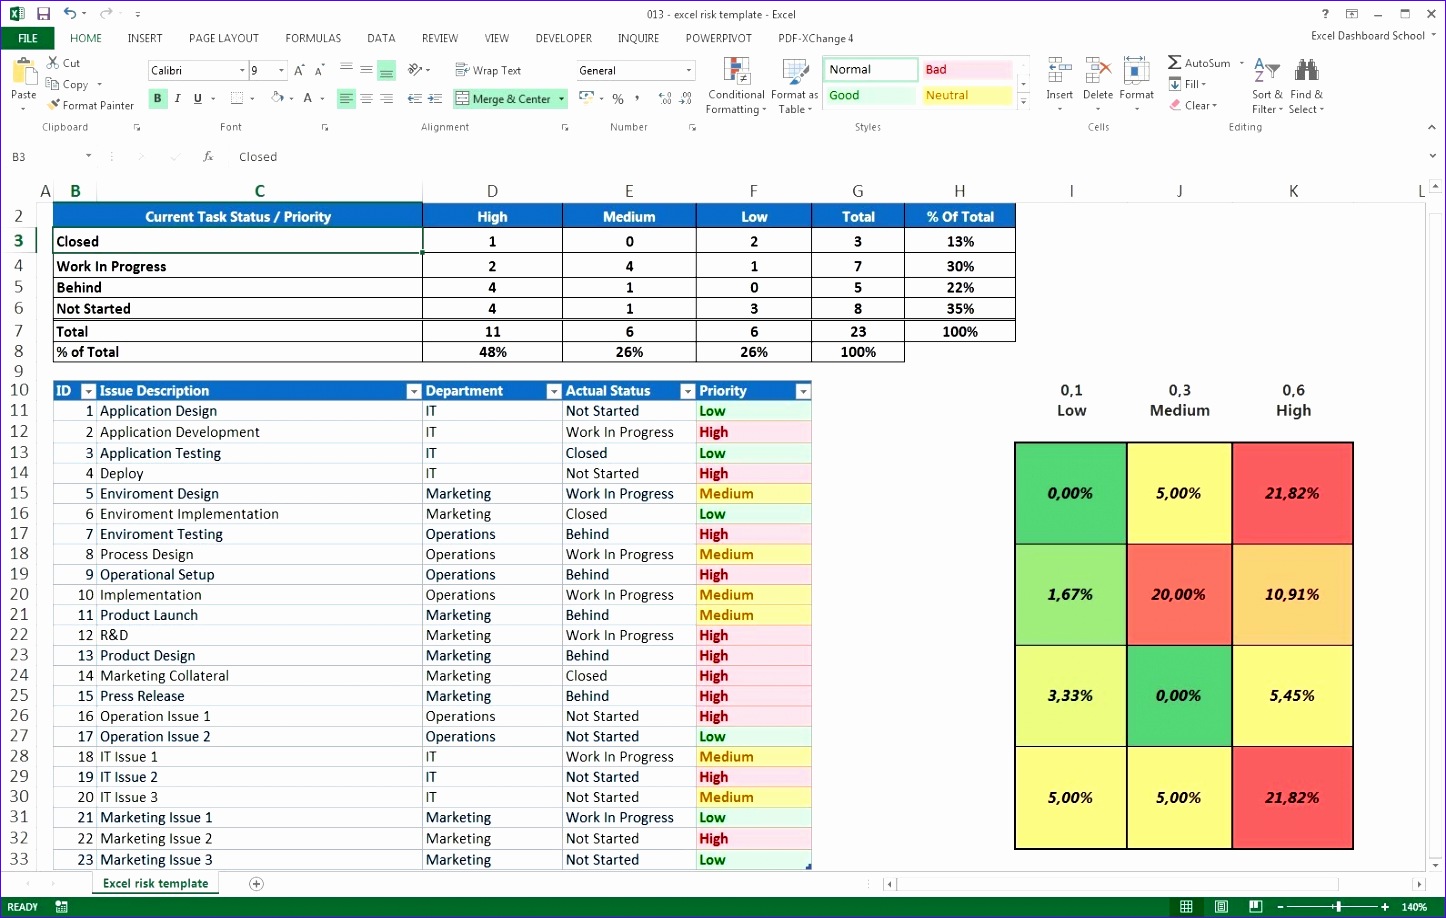
Is this a dashboard?
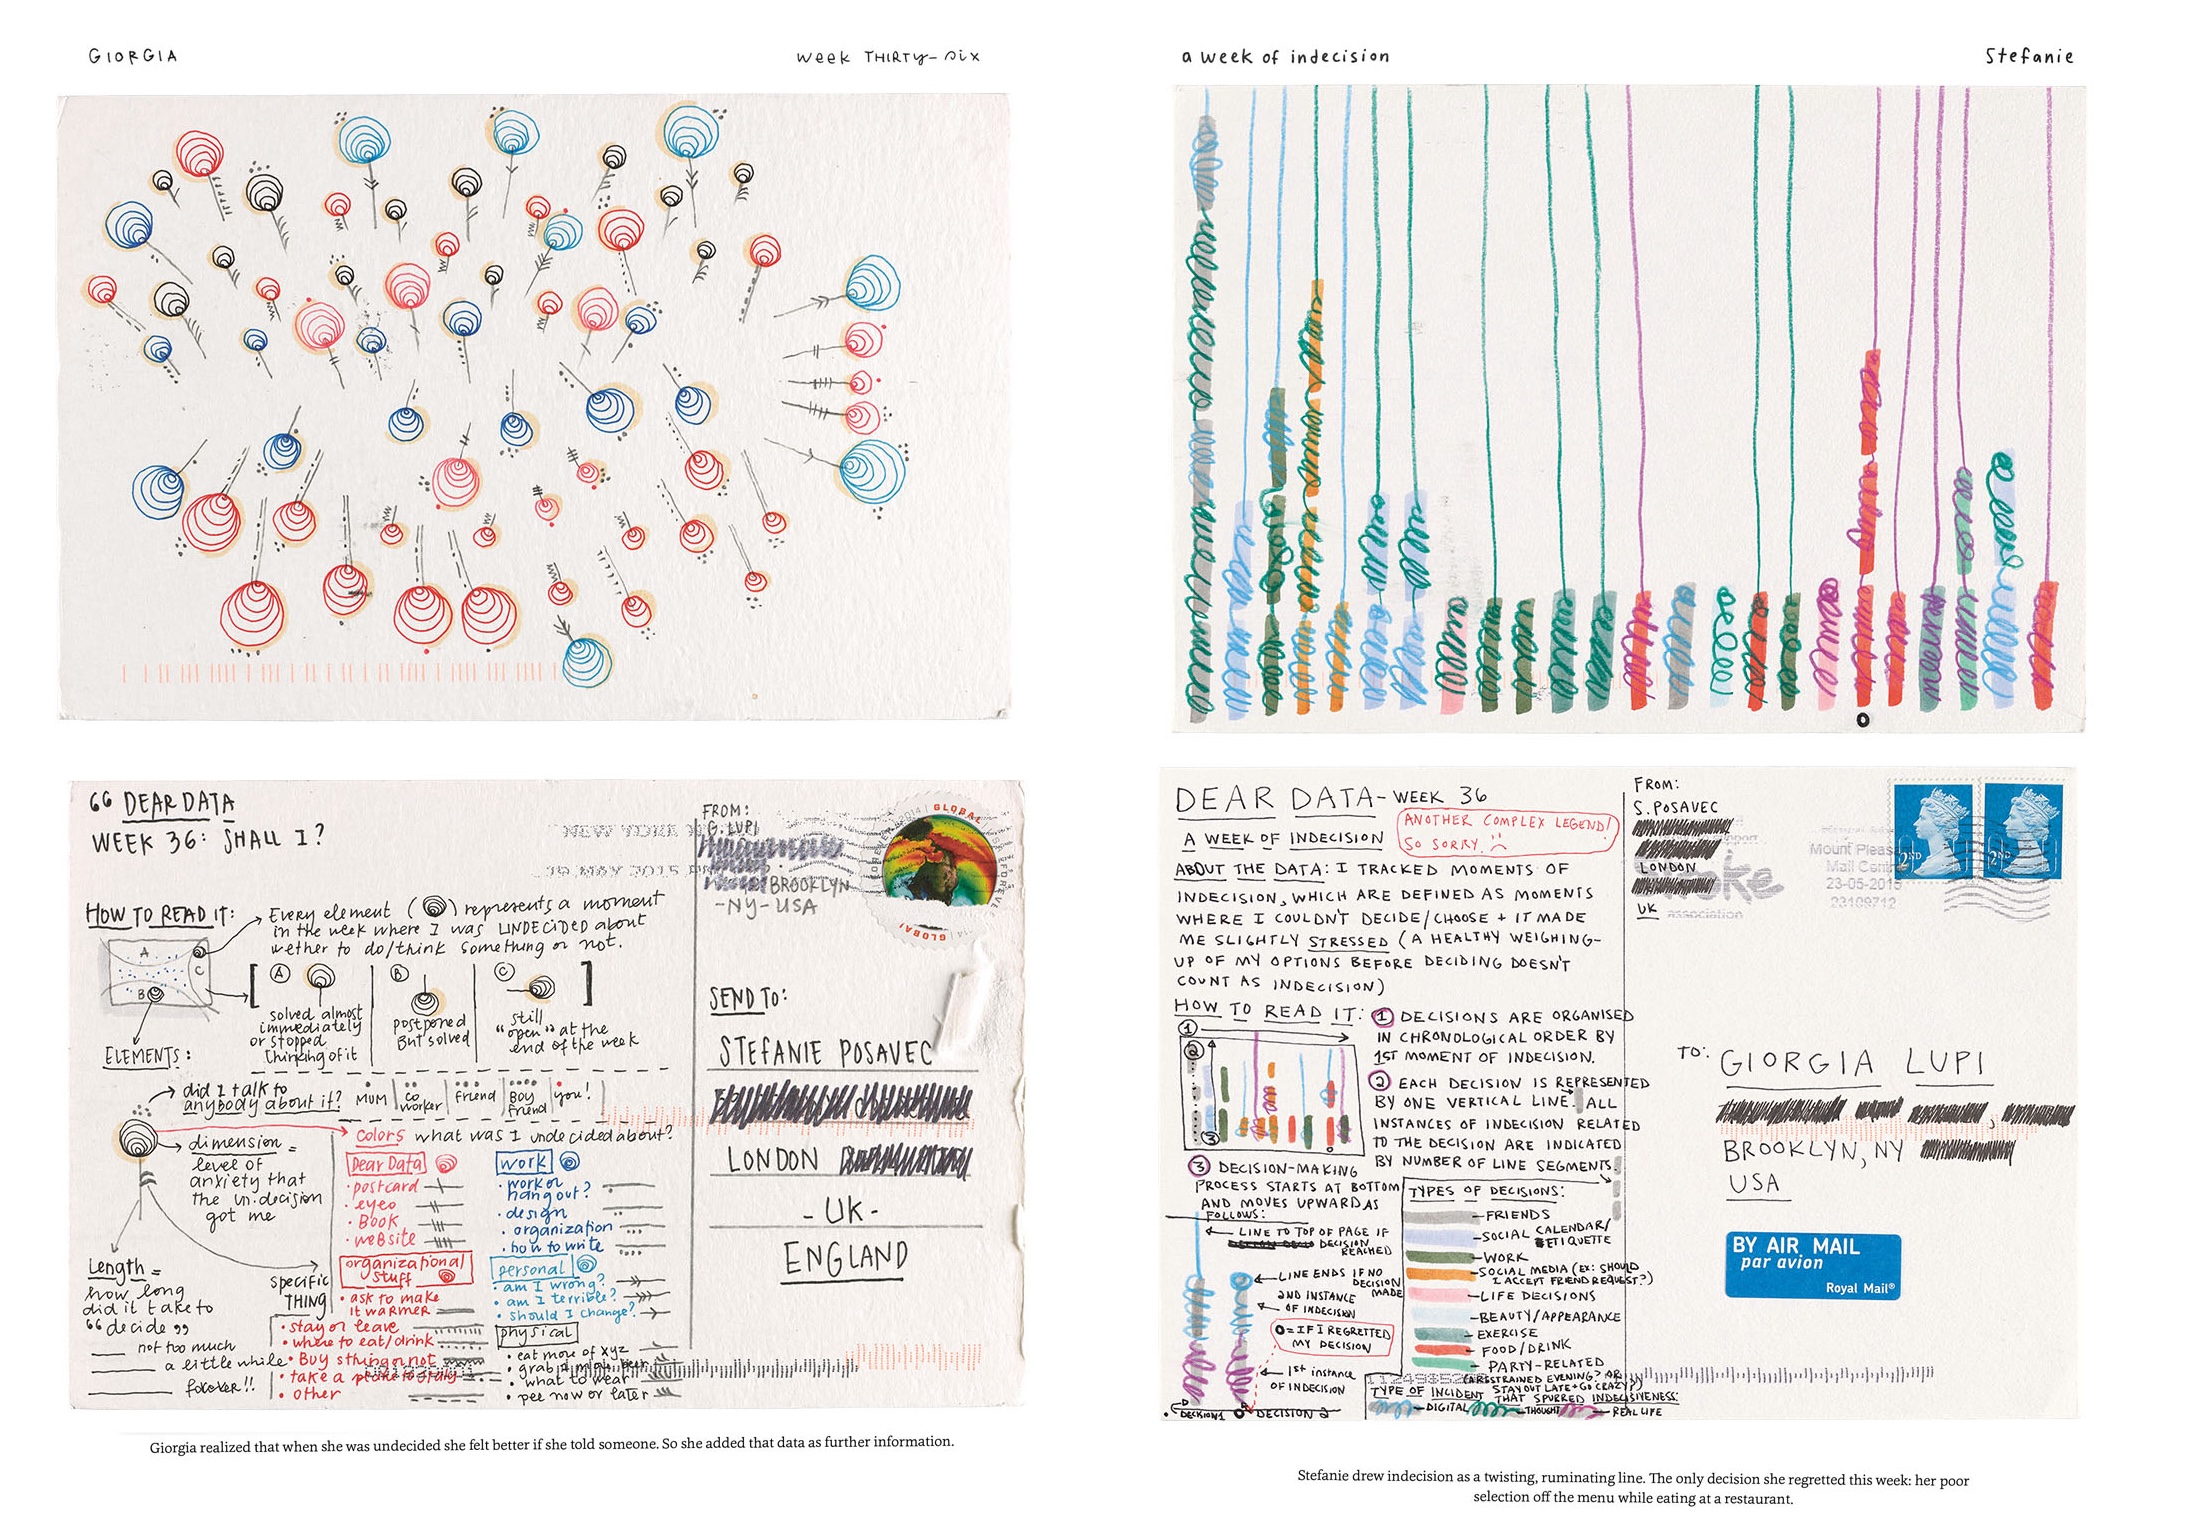
Is this a dashboard?
shiny
library(shiny)


ui <- fluidPage(

)

server <- function(input, output, session) {

}

shinyApp(ui, server)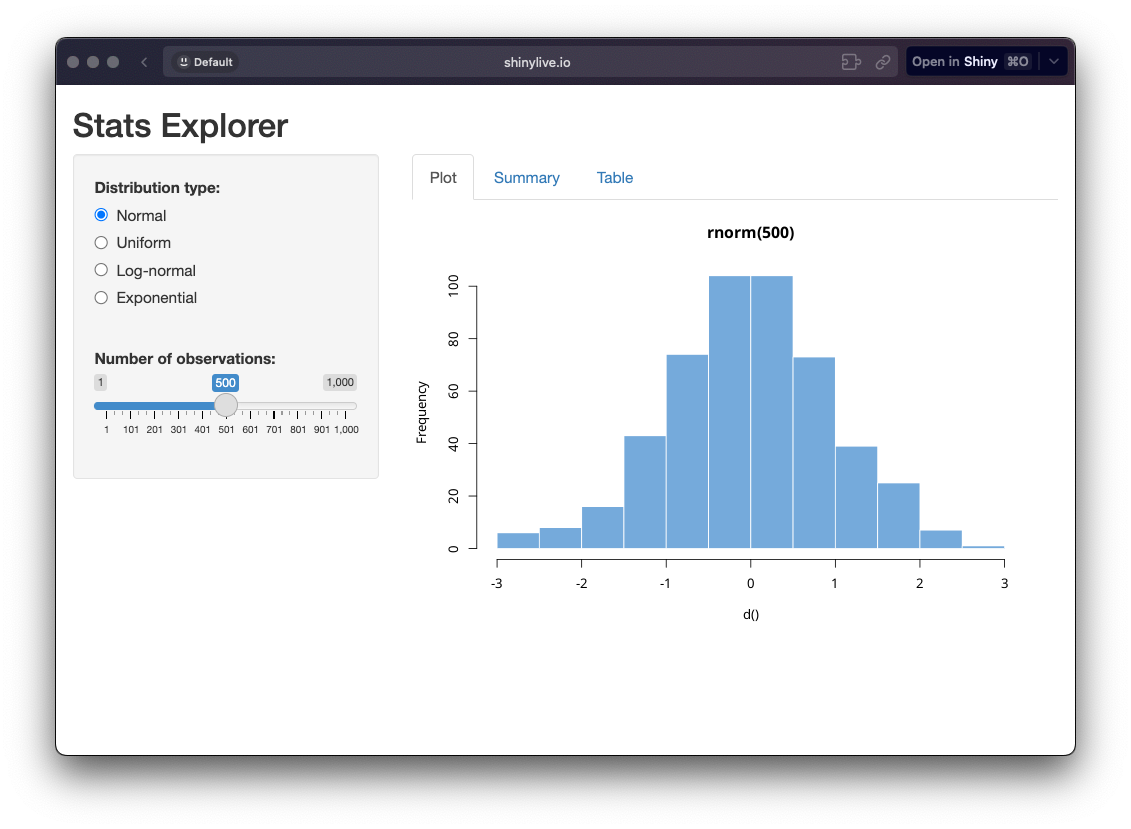
shiny + bslib
library(shiny)
library(bslib)

ui <- page_fluid(

)

server <- function(input, output, session) {

}

shinyApp(ui, server)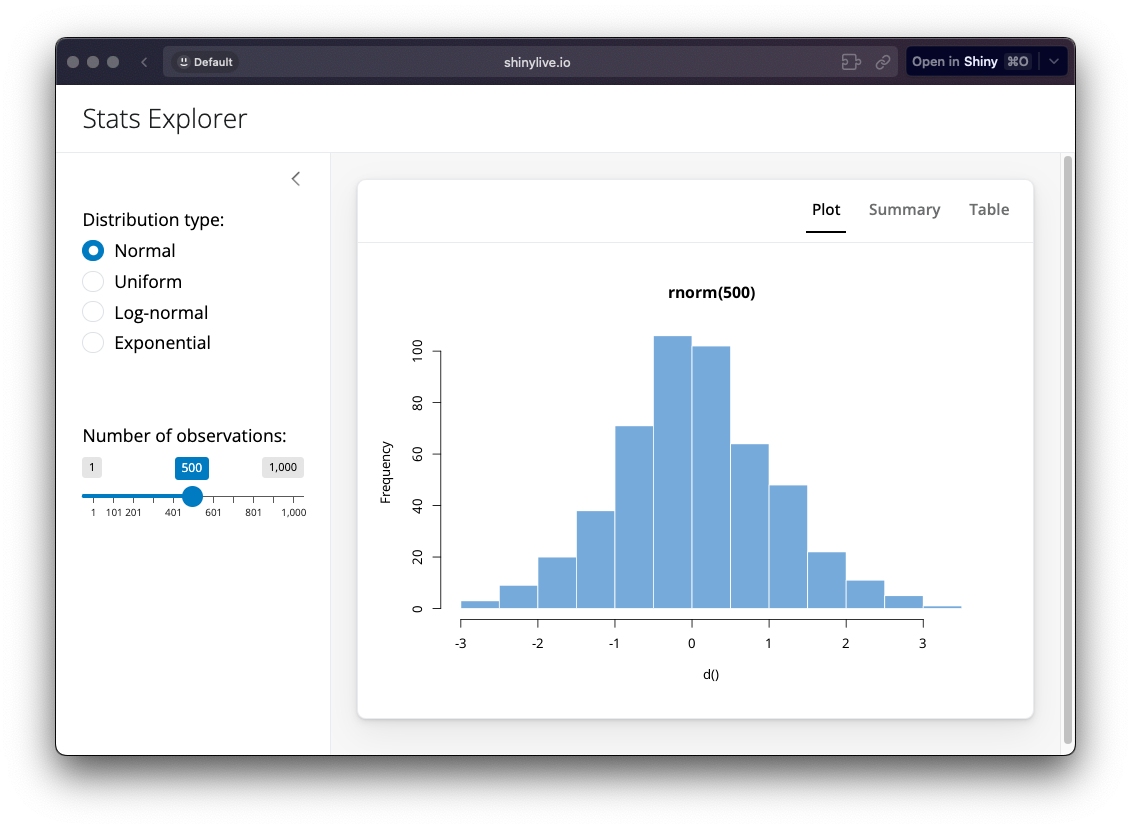
Choose your page

page_sidebar()

page_navbar()
page_fillable()
Value boxes
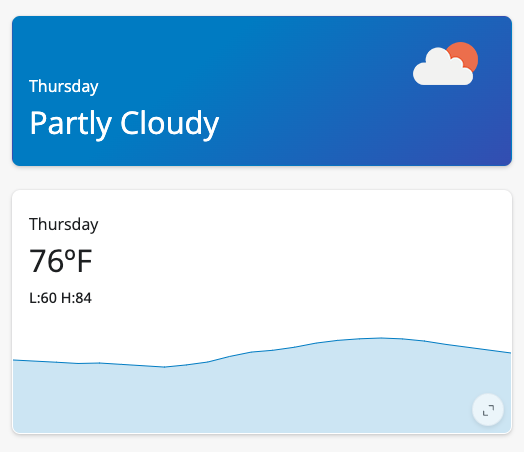
value_box(
  title = textOutput("wday"),
  value = uiOutput("weather"),
  showcase = uiOutput("icon"),
  showcase_layout = "top right",
  theme = "bg-gradient-blue-purple"
)

value_box(
  title = textOutput("wday"),
  value = textOutput("avg_temp"),
  showcase = plotlyOutput("plot"),
  showcase_layout = "bottom",
  full_screen = TRUE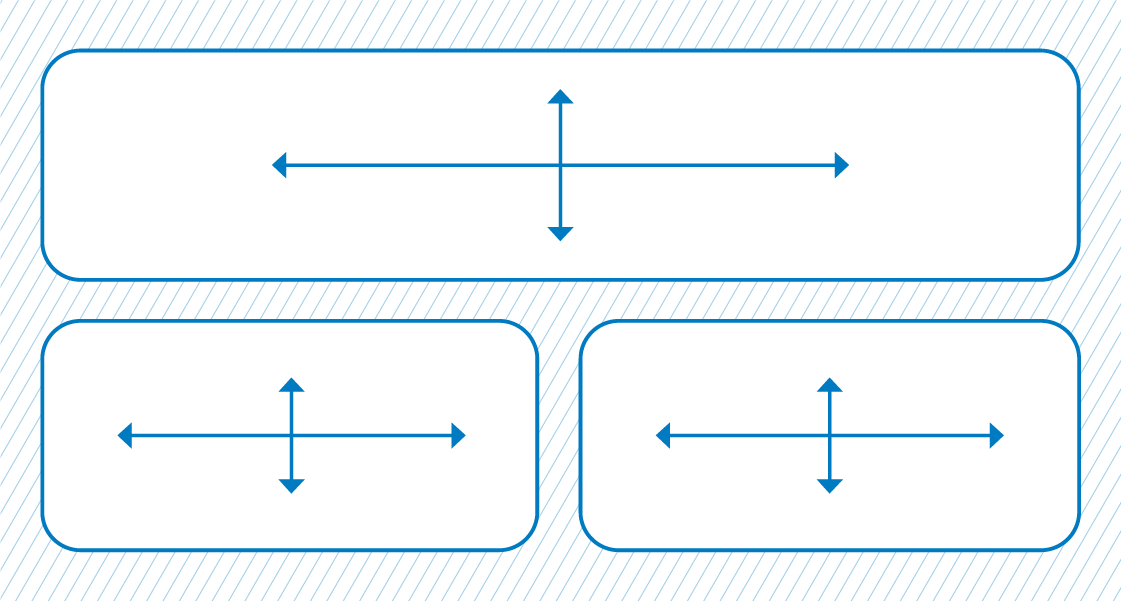
)Layout columns

layout_columns(
  value_box(...),
  value_box(...),
)
or
layout_column_wrap(
  value_box(...),
  value_box(...),
)
Accordions
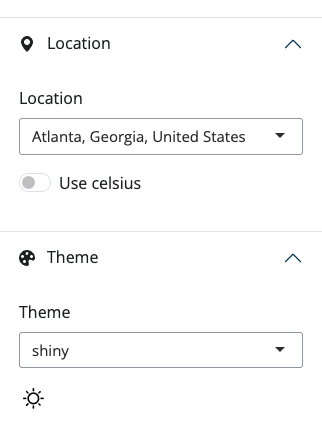
accordion(
  accordion_panel(
    "Settings",
    ...
  ),
  accordion_panel(
    "Theme",
    ...
  )
)
Tooltips & Popovers

tooltip(
  trigger_element,
  strong("Thursday"),
  # ...
)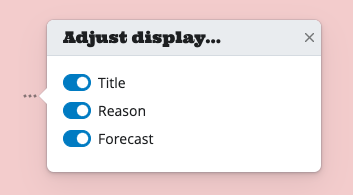
popover(
  bsicons::bs_icon("three-dots"),
  title = "Adjust display..."
  input_switch("show_title", "Title"),
  # ...
)
Task Button
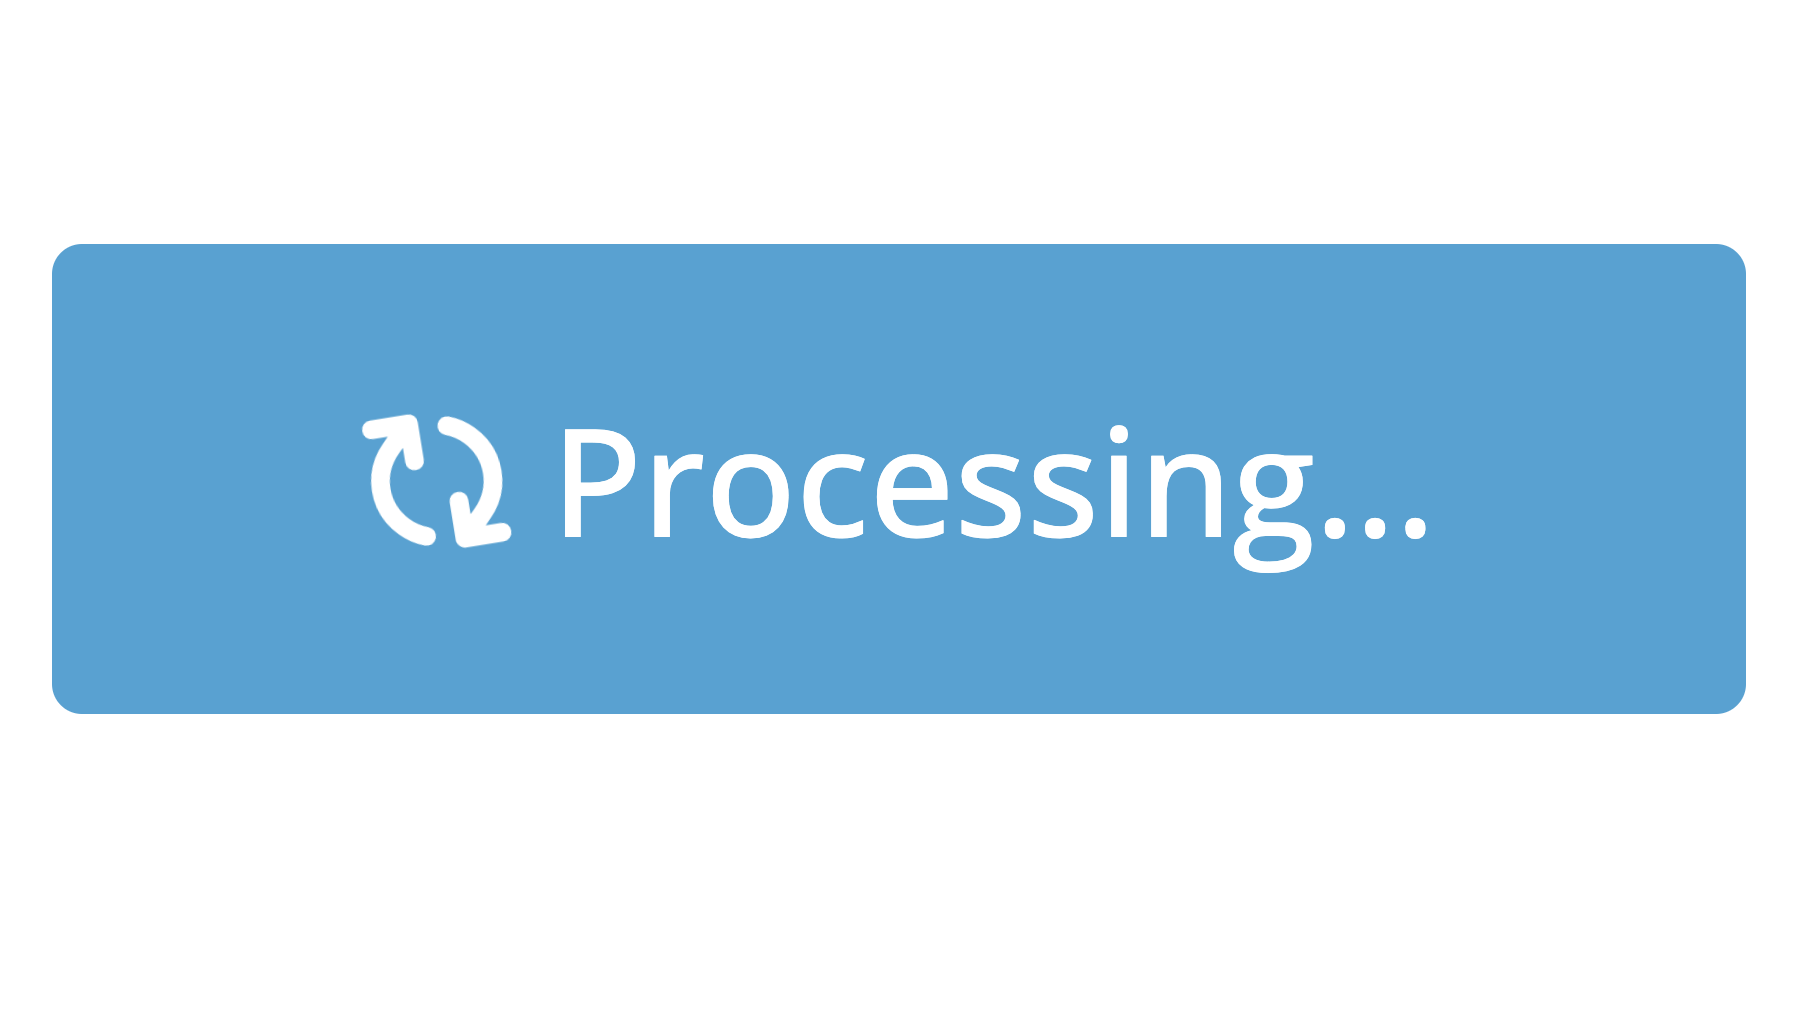
# instead of this...
actionButton(
  "save_location",
  "Get Forecast"
)

# use this!
input_task_button(
  "save_location",
  "Get Forecast"
)
Dark Mode!


input_dark_mode()

input_dark_mode(id = "dark_mode")
#> input$dark_mode